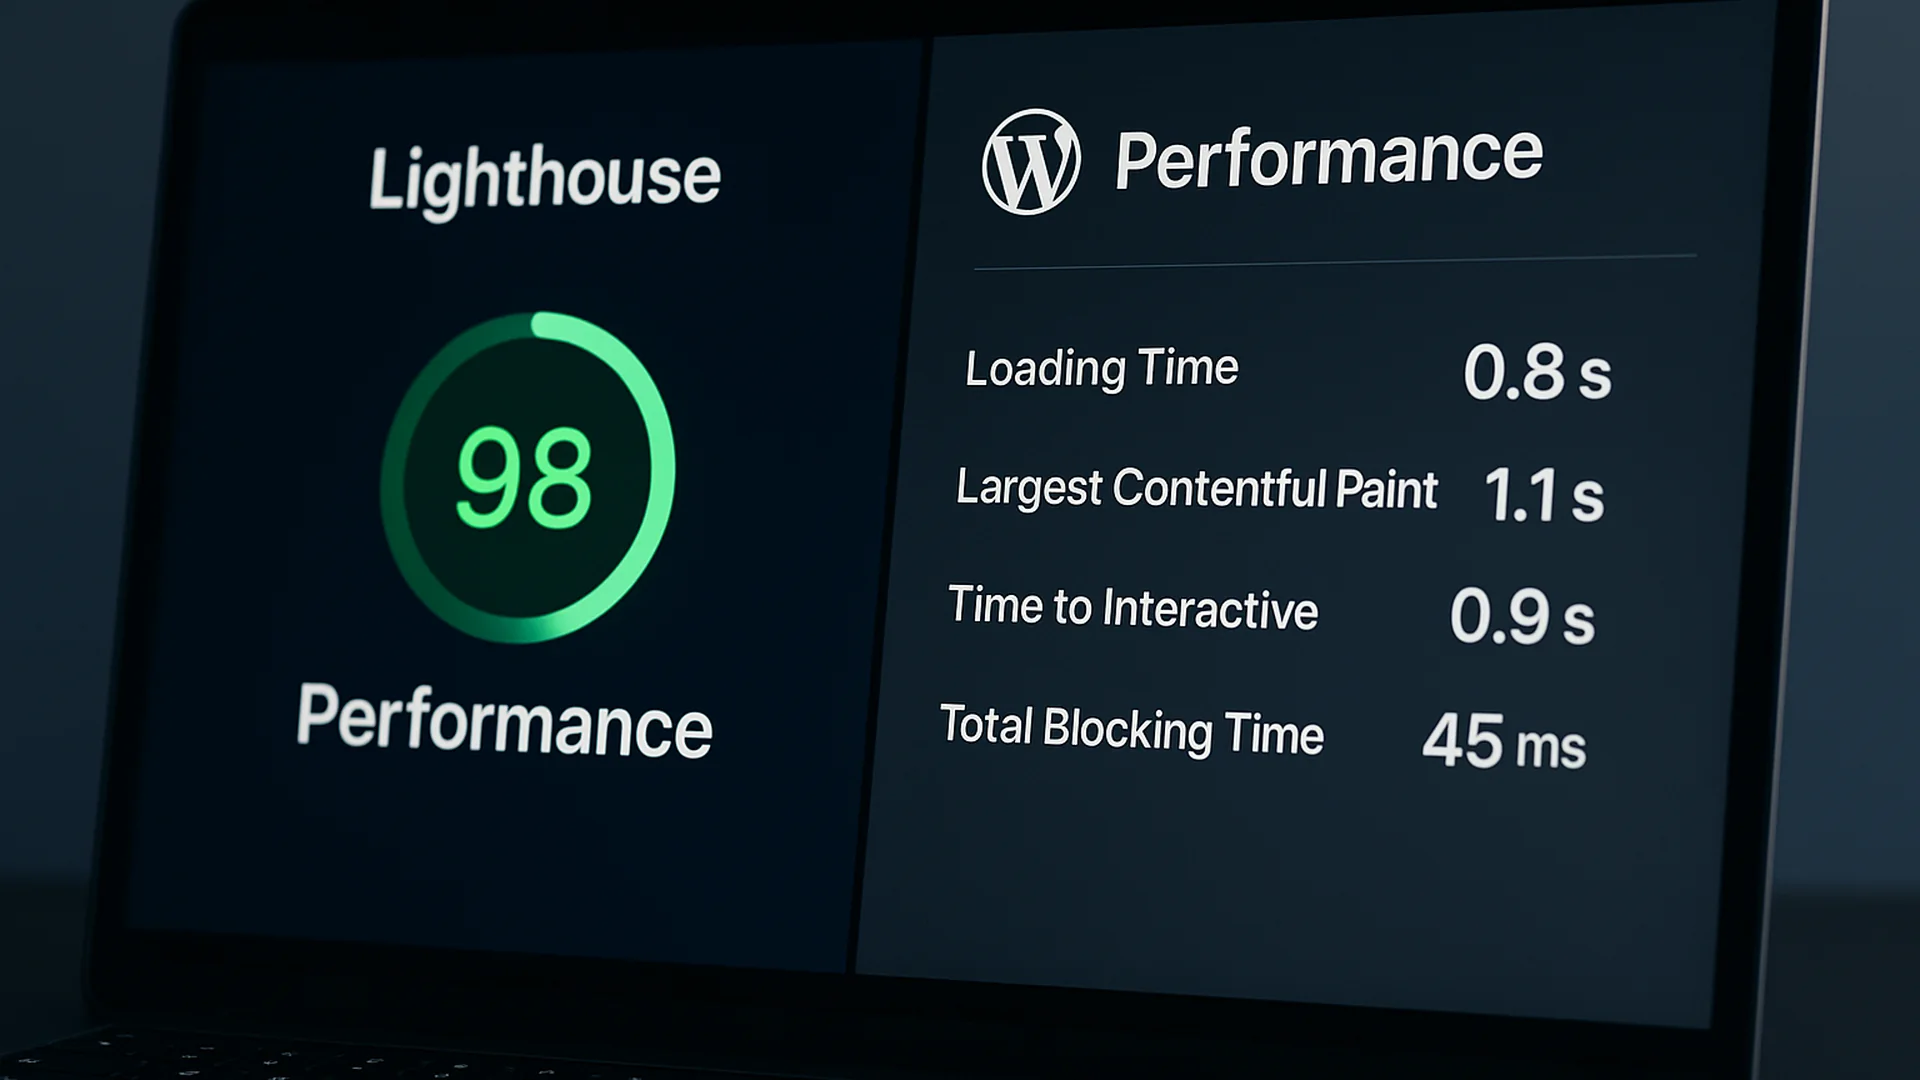
A perfect Lighthouse score is the easiest way to lose three hours and end up with a slightly faster homepage that still doesn’t convert. The score measures what’s measurable in thirty seconds inside a browser, and the things that drive revenue sit outside that window. Here’s what to look at instead.
If you haven’t used it: Lighthouse is a free audit built into Chrome. It loads a single page in a controlled emulator and hands back a score out of 100 with a list of suggested fixes. Agencies and procurement teams tend to look at that number first, which is exactly how it became a number people chase. The trouble is that the audit runs in a vacuum, and your visitors don’t.
Key takeaways
- Lighthouse is a synthetic snapshot; real-user metrics tell a different story.
- Core Web Vitals are the search-engine floor; the user-experience bar sits above them.
- Most WordPress performance debt is server-side, in plugins and themes, where Lighthouse can’t see it.
- Three fixes move real-world numbers: cache-first architecture, a plugin audit, and the image pipeline.
- A 15-minute browser audit catches more ROI than a half-day Lighthouse chase.
A perfect Lighthouse score is the easiest way to lose three hours and end up with a slightly faster homepage that still doesn't convert.
What is a good Lighthouse score?
A good Lighthouse score sits at 90 or above across Performance, Accessibility, Best Practices, and SEO, with 100 meaning the automated run found nothing left to flag. Getting a perfect Lighthouse score (100) on WordPress is possible with enough caching and image work, but a 100 isn’t the same thing as a fast, revenue-producing site. Lighthouse measures one simulated page load in a lab. It doesn’t measure what a real visitor, on a real connection, with a real reason to buy, actually experiences.
Lighthouse runs one page, cold, under a fixed throttle, and reports a composite. That’s genuinely useful for catching regressions, and it’s a fine debugging surface for a developer. Your visitor, though, experiences something else entirely. Your real users mostly arrive on warm caches; Lighthouse always tests cold. Repeat visits are dramatically faster; Lighthouse can’t simulate one. A fixed throttle preset is nothing like the long tail of real mobile networks. And the audit fires a single synthetic request at an idle server, so it never sees how your plugins behave when fifty requests land at once, or how the tag manager and the live-chat widget elbow each other in a real session.
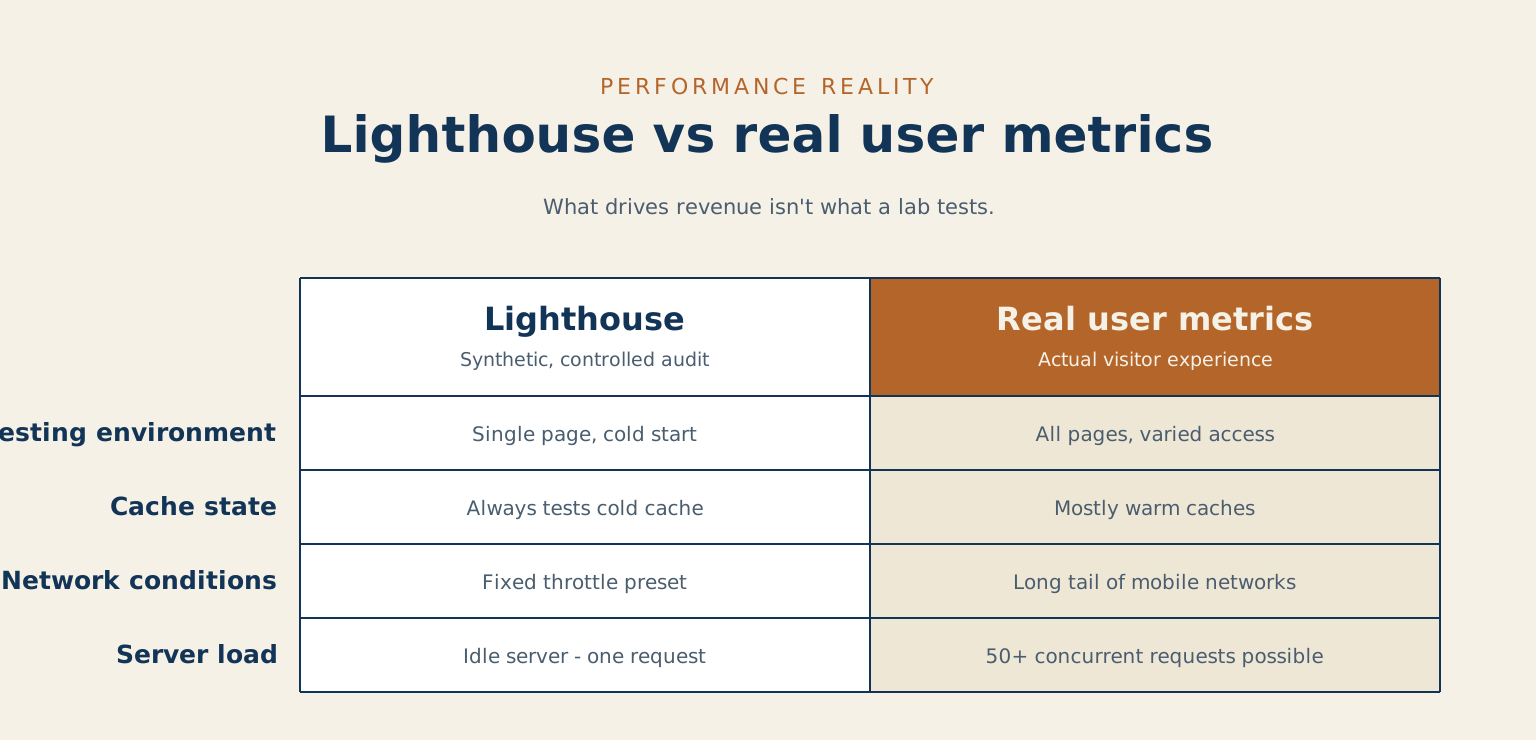
Treat the score like the check-engine light, not the speedometer. It tells you something may be wrong. It does not tell you how the car drives.
Treat the score like the check-engine light, not the speedometer.
The metrics that predict revenue
Two layers matter. The floor is Core Web Vitals, the three thresholds Google uses in ranking: Largest Contentful Paint under 2.5 seconds, Interaction to Next Paint under 200 milliseconds, Cumulative Layout Shift under 0.1. Google’s own web.dev documentation covers the definitions well. Clearing the floor keeps you in the game, and that’s all it does.
Above the floor, watch what real visitors experience instead of what a test lab simulates. The number to ask for is the 75th percentile, which just means sorting every real visit from slowest to fastest and looking at the one three-quarters of the way down. That is the experience a quarter of your visitors are having or worse, and the average politely hides it. Ask for it on two things: how long the main content takes to appear, and how quickly the page reacts when somebody taps it.
Watch bounce rate by device as well, because when mobile bounces twelve points above desktop, performance is usually the reason. And measure the pages that earn money. Your homepage is not where you make it; your service pages and your contact page are. If you watch a single number, make it the 75th-percentile load time on your busiest service page, because that number only moves when something real has changed.
Where WordPress slows itself down
The single biggest source of performance debt on a typical service-business site is WordPress overhead, and Lighthouse rarely surfaces it because the damage happens server-side, before any HTML reaches the browser. The usual suspects, roughly in order of harm: plugins that run their code on every single page load whether that page needs them or not (on a thirty-plugin site, five to eight are typically doing real damage); themes that re-run database searches in the sidebar and footer on every request; the pile-up of every active plugin taking its turn to modify the content before the page ships, which can cost 200 to 400 milliseconds on a content-heavy page; a missing persistent object cache, which means the site re-asks the database for the same settings on every visit instead of remembering them; and header and footer sections that check who is logged in or what is in the cart, and so can never be served from cache.
The diagnostic tool for all of this is a query-and-hook profiler, Query Monitor being the usual choice, running on a staging clone with the slow-query log enabled. Ten minutes there tells you more than an afternoon of score-chasing.
The three fixes that change real numbers
Once you’ve measured the actual problem, the highest-ROI interventions come in a reliable order, and each one covers a specific set of work.
| Fix | What it covers | What it usually does |
|---|---|---|
| Cache-first architecture | Page cache for the rendered HTML, object cache for database lookups, code cache for compiled PHP, and aggressive HTTP cache headers on static assets | Most managed hosts ship two of the four. Getting all four in place typically halves p75 LCP without touching a line of application code. |
| Plugin audit | Disable plugins one at a time on staging and re-measure. Anything adding more than 50 milliseconds either justifies itself as load-bearing or comes out. | Plugins that earn their cost, however many that turns out to be. |
| Image pipeline | WebP or AVIF as the served format, properly sized variants for the breakpoints you use, lazy-loading below the fold, and the LCP image preloaded explicitly | Most WordPress sites ship images three to five times larger than the rendered size. This fix alone often flips a Core Web Vitals verdict from Needs Improvement to Good. |
Start at the top of the table. The first row moves the most and costs the least, and the third row is the one most sites skip because it looks like housekeeping.
Everything past those three is fine-tuning. Worth doing, eventually, but the gains shrink while the effort grows.
How teams game the score and hurt the site
The score is gameable in ways the user experience never is, and every gaming move follows the same shape: it nudges the number while regressing the reality. Lazy-loading the hero image shaves a tenth off the simulated load and adds half a second to the real one. Defer-everything JavaScript makes the audit happy and turns your visitor’s first click into a stutter, which regresses INP, which is part of the ranking signal anyway. Inlining critical CSS without a path strategy makes page one fast and every subsequent page slower. And polishing the homepage to 95 while the service pages sit at 60 optimizes the page that doesn’t convert at the expense of the ones that do. The teams that fall into these traps were told “get the score above 90,” and the test rewarded them for feeding it instead of asking what it was a proxy for.
The 15-minute audit to run instead
Before you spend a half-day on the score, spend fifteen minutes on this:
- Open Chrome DevTools, Network tab. Throttle to Slow 4G, set CPU throttling to 4x, and tick “Disable cache.”
- Hard-reload your top-converting service page, not your homepage.
- Note the three slowest items by transfer size and the three slowest by load time.
- Repeat once for a different template (a blog post or the contact page).
If the slowest items match across templates, you have a sitewide problem: cache, theme, or fonts. If they differ, you have a template-specific problem: a plugin scoped to that page, or a third-party script that only loads there. Fifteen minutes of diagnosis, and you know where the next ten hours should go.
Most of this work is honestly DIY-able with a long afternoon and a staging site you’re willing to break. It stops being DIY when the bottleneck needs host-level access, when caching misbehaves differently page to page, when two plugins fight over the same hook and the answer requires reading both source codes, or when the slow template is also the conversion path and any change carries risk. That last category is where a standing care arrangement earns its keep, because the person doing the tuning already knows where the bodies are buried.
Common questions about WordPress performance scores
Should I ignore my Lighthouse score completely? No. Treat it as a regression check. It’s useful for catching when something breaks, but clear your Core Web Vitals in real-user data first. If you want a second read, a site audit looks at the pages that convert, not just the homepage.
My score is high but the site still feels slow. Why? Lighthouse tests one cold page on an idle server. Real visitors arrive on warm caches, over real networks, on a server handling many requests at once, so the felt experience lives outside what the score can see.
What if the slow page is also my main conversion path? That’s the one place to be careful, because any change carries risk. When the slow template is the page that earns money, it’s worth bringing in help before you start pulling plugins. A speed optimization pass, a rescue engagement, or a short conversation can keep you from breaking the page you most need working.
The sites that quietly outperform their Lighthouse scores are usually the ones whose teams stopped chasing it. The audit sits somewhere in the high seventies, real-user p75 LCP holds under 2.5 seconds on the templates that convert, and everyone measures what maps to revenue instead of the number procurement asked about first. Real performance is boring from the inside. It is anchored to the user, and it has quietly stopped caring about the score.
Leave a reply